3D Slicer Beginner Friendly Blender Blog Bruker Skyscan careers Communication and Outreach Conferences CT Basics Data Analysis Data Postprocessing Education Fiji/ImageJ Free Sample Data jobposting MeshLab Nikon OpenScience Paleontology Paper PDF Phoenix GE/Waygate Physics of CT PowerPoint Reconstruction Sample Prep Scanning Segmenting VGStudio Video Website YouTube Channel Zeiss Xradia
-
Guidelines for Acknowledgements in papers that use CT data
Why are acknowledgements important?
Acknowledgements are more than just a feel-good afterthought when submitting your paper: they are of material value to technical staff, shared labs, and future readers of your papers.
Technical staff involved in a wide range of projects can use named acknowledgements to demonstrate their value when seeking promotions or new job opportunities.
Shared Lab Spaces and Core Facilities use acknowledgments (whether of the named facility, PIDs such as RRIDs, or of grant numbers) to justify the resources they use and determine future resource allocation. Granting agencies look at the footprint generated by grants when deciding on future funding for academic labs: therefore, if you find instrumentation access useful and want it to continue, you should acknowledge the facility, and, when relevant, any grant numbers the facility supplies for the work you perform.
Lastly, by acknowledging individuals who contributed to your work, future readers can be made aware of institutional knowledge and resources that are available to them. More people knowing about a facility guarantees its longevity, which is good for everyone!
When should I acknowledge a facility or individual?
A facility should always be acknowledged if staff, data, or instrumentation was used directly or indirectly in research.
A grant or funding number that helped in the purchase or support of an instrument or facility should be included if that resource contributed to the published research.
When should key personnel be acknowledged? Expectations for acknowledgment and/or coauthorship vary, but a list of common contribution scenarios are outlined below:
Contributions to research which may merit an acknowledgement:
- Training of the user to acquire data or images themselves
- Recommendation of software and tools used in data acquisition and analysis
- Basic data analysis help and advice
- Routine sample preparation with standard protocols
- Routine acquisition of raw data
Contributions to research which may merit coauthorship:
- Development of new sample preparation protocols
- Optimization of existing protocols
- Operational image acquisition with input and decisions dependent on expertise
- Design or re-design of experimental conditions
- Constructive data analysis and interpretation
- Significant contributions to the manuscript
How do I know who and what should be acknowledged?
Confirm a list of instruments and key staff involved with all coauthors prior to publication, and contact the facility staff or director to confirm that the given details are correct.
Examples of Acknowledgements:
We include a few examples of acknowledgements below, in no particular order. Check papers in your field for other examples.
Imaging work was performed at the Northwestern University Center for Advanced Molecular Imaging (RRID:SCR_021192) generously supported by NCI CCSG P30 CA060553 awarded to the Robert H Lurie Comprehensive Cancer Center.
Imaging data was acquired through the Cornell Institute of Biotechnology’s Imaging Facility (RRID:SCR_021741) with NIH S10OD025049 funding for the SkyScan 1276 mouse CT.
This research used resources of the Advanced Photon Source (APS), a U.S. DOE Office of Science User Facility operated for the DOE Office of Science by Argonne National Laboratory under contract No. DE-AC02-06CH11357.
These data and/or images were produced at the University of Texas High-Resolution X-ray CT Facility (UTCT), which is supported by NSF EAR-2223808 and NASA PSEF 80NSSC23K0199
This work (or insert specific portions of data) was produced with the assistance of personnel (e.g. Jane Doe) using the equipment (e.g., Bruker SkyScan 1173 Micro-CT system) at the Florida Atlantic University Laboratory Schools Marcus Research and Innovation Center (RRID:SCR_023805).
This work was conducted in part at the Nanoscale Research Facility of the Herbert Wertheim College of Engineering at the University of Florida with the valuable assistance of___________.
-
What is microCT imaging?
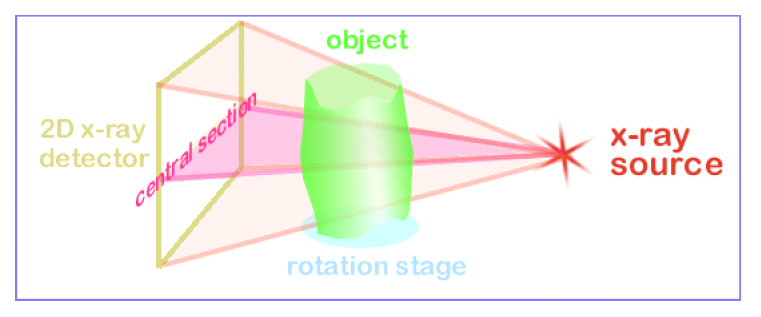
MicroCT imaging, short for micro-computed tomography, is a technique that uses X-rays to create detailed 3D images of objects. It works by taking many 2D X-ray images, called projection images, of an object from different angles and then combining them using a process called reconstruction to form a 3D virtual histology of the object. This method is non-destructive, meaning the object being scanned remains intact.
Thank you to Murat Maga at the Seattle Children’s Research Institute’s Center for Developmental Biology and Regenerative Medicine for organizing this tutorial.
-
Practical Microcomputed Tomography Workshop
Create by Stuart Stock, hosted by the Northwestern University Feinberg School of Medicine
Description
This record presents the material presented at the Denver X-ray Conference (DXC), Aug 2024, in Westminster, CO. It is designed to introduce practical numerical analysis of microCT data and the effect of data collection parameters for those interested in learning more about x-ray tomographic data analysis.
Access the workshop materials here.
Breif Description:
Workshop Title: Practical Microcomputed Tomography
Instructor: Stuart R. Stock (Northwestern Univ.)
Activities: Hands-on except for a brief intro to microCT and definition of terms.
Guided analyses on the participants’ own laptops. Use of ImageJ tools. Data collected beforehand by the instructor on a Skyscan 1272 system.
The Word document describes the activities using the data files in the participants files directory. The annotated files directory has the files for the activities but they are annotated for the participants reference.
The author thanks Luisa Arispe for use of the microCT scanner in her laboratory.
-
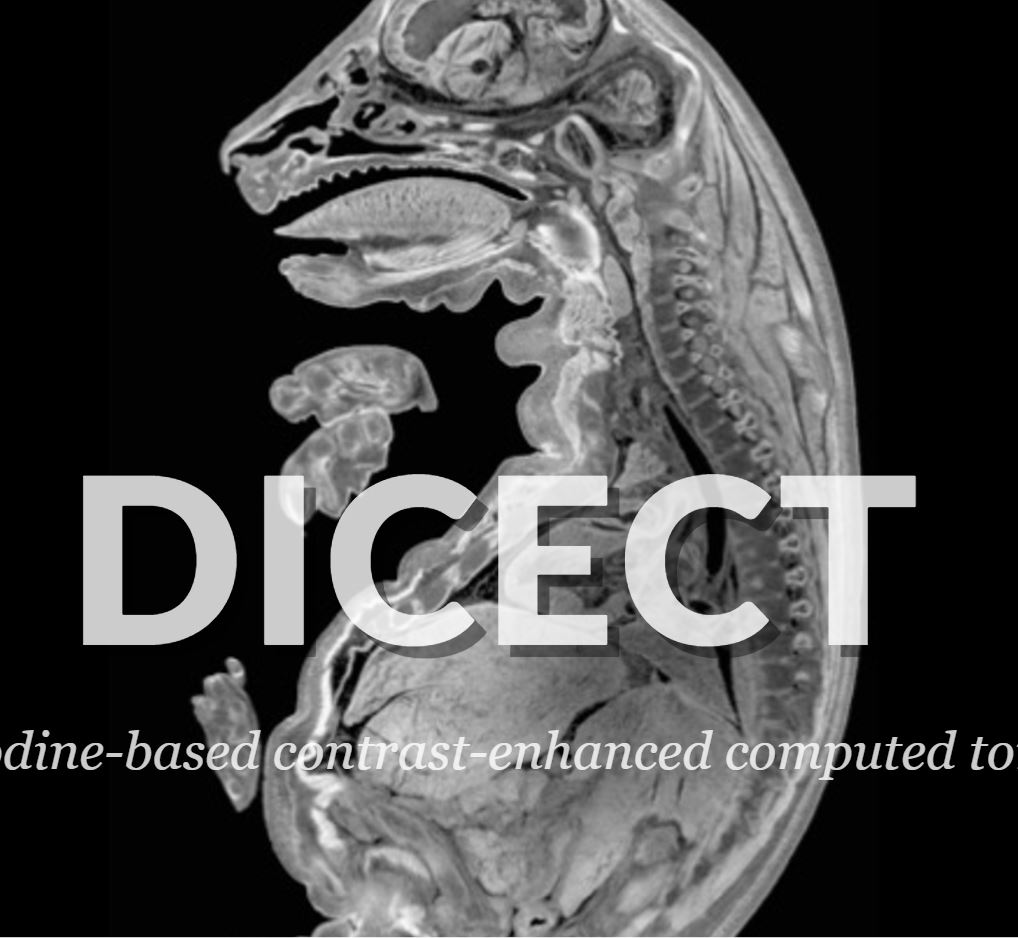
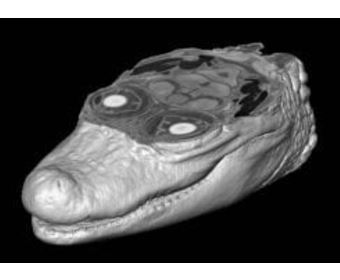
diceCT: Diffusible Iodine-based Contrast-enhanced Computed Tomography
Website that has a collection of resources, blog posts, and papers relating to diceCT. Some notable papers listed on the webpage include:
Gignac, Paul M., Nathan J. Kley, Julia A. Clarke, Matthew W. Colbert, Ashley C. Morhardt, Donald Cerio, Ian N. Cost et al. “Diffusible iodine‐based contrast‐enhanced computed tomography (diceCT): an emerging tool for rapid, high‐resolution, 3‐D imaging of metazoan soft tissues.” Journal of anatomy 228, no. 6 (2016): 889-909. https://doi.org/10.1111/joa.12449
Gignac, Paul M., and Nathan J. Kley. “The utility of diceCT imaging for high-throughput comparative neuroanatomical studies.” Brain Behavior and Evolution 91, no. 3 (2018): 180-190. https://doi.org/10.1159/000485476
Orsbon, Courtney P., Nicholas J. Gidmark, and Callum F. Ross. “Dynamic musculoskeletal functional morphology: integrating diceCT and XROMM.” The Anatomical Record 301, no. 2 (2018): 378-406. https://doi.org/10.1002/ar.23714
Llambrich, Sergi, Jens Wouters, Uwe Himmelreich, Mara Dierssen, James Sharpe, Willy Gsell, Neus Martínez-Abadías, and Greetje Vande Velde. “ViceCT and whiceCT for simultaneous high-resolution visualization of craniofacial, brain and ventricular anatomy from micro-computed tomography.” Scientific Reports 10, no. 1 (2020): 18772. https://doi.org/10.1038/s41598-020-75720-3
And more!
-
Ecology and Evolutionary Biology Museums YouTube Channel, CT Data & Segmentation Tutorial Series
By Ramon Nagesan, University of Michigan Museum of Zoology
YouTube playlist of tutorials that range from introduction to CT Data, MorphoSource, and processing data in VGStudio.
https://www.youtube.com/playlist?list=PLRu5Ab94NHuxquFgNafDfVY6cJPe1jWRt
Beginner Friendly, CT Basics, Data Analysis, Data Postprocessing, Nikon, Segmenting, VGStudio, Video
-
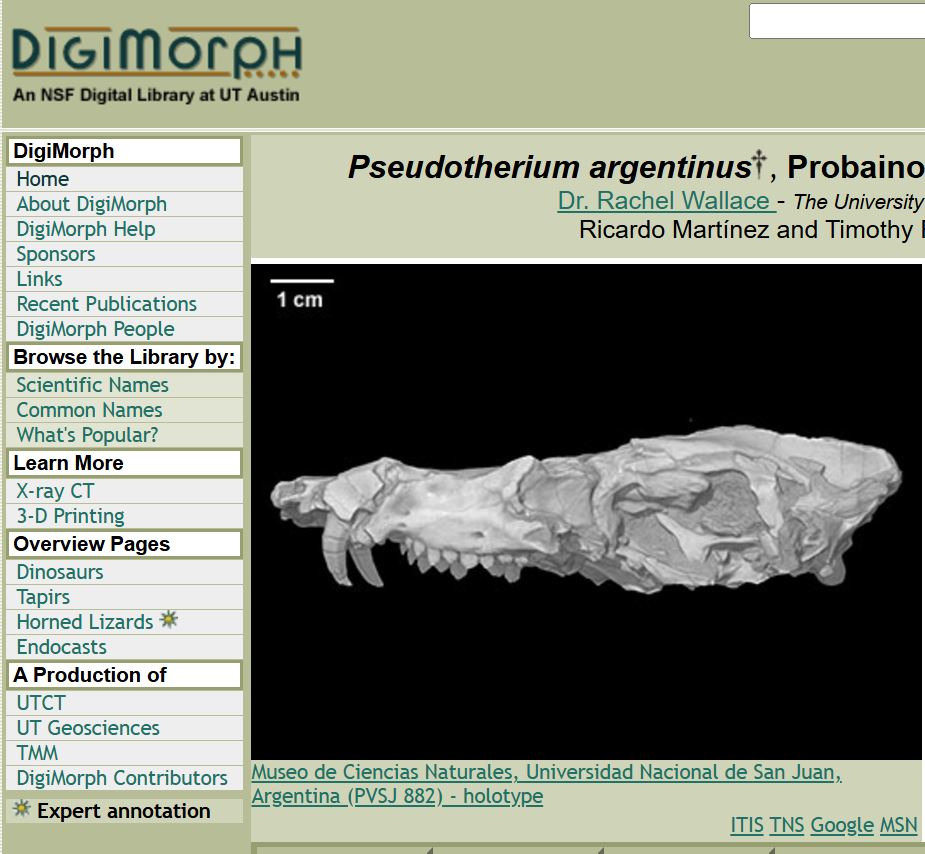
DigiMorph
By UTCT, University of Texas
https://www.digimorph.org/index.phtml
The Digital Morphology library is a dynamic archive of information on digital morphology and high-resolution X-ray computed tomography of biological specimens.
-
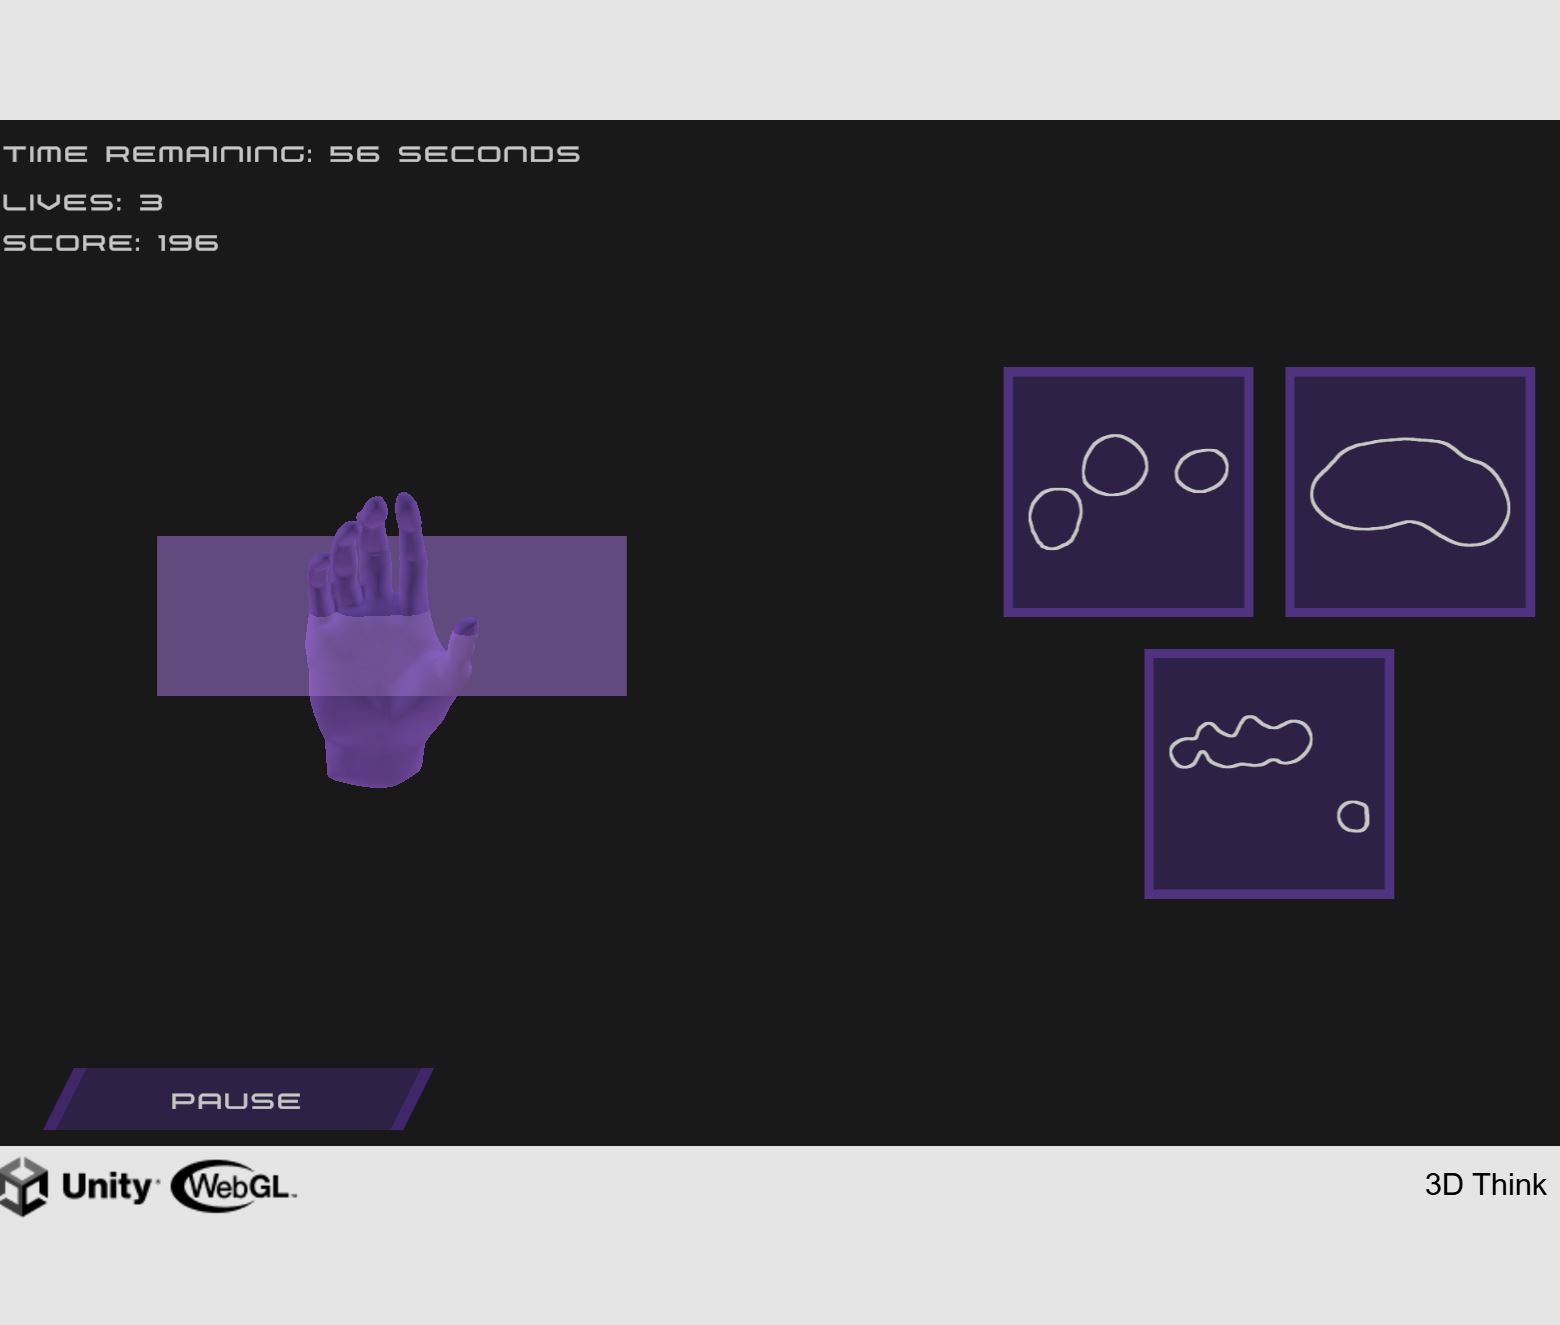
3D Think Game by ERSUCC
By Isaac Brown, David Dunand, John Misiaszek, Samuel Pennell
https://ersucc.itch.io/3d-think
Test your spatial reasoning with this puzzle game inspired by tomography!
-
Collections Education Coffee Break Series: oVert TCN Resources for Education
By Jaimi Gray, UTCT, University of Texas
https://qubeshub.org/publications/2760/1
A brief introduction to educational resources associated with the oVert project. This resource includes the slides and recording of Dr. Jaimi Gray’s presentation as well as links to all of the resources she discusses (doi:10.25334/95DJ-MY09)
-
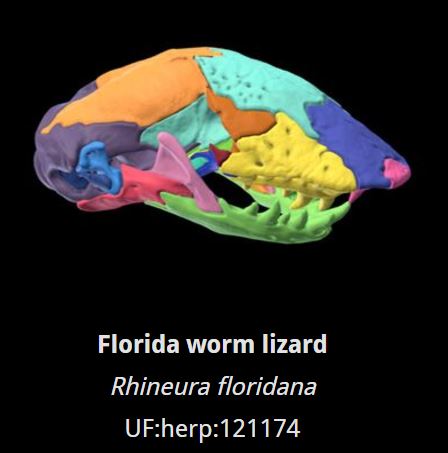
Gray’s Colors of Skull Anatomy
By Jaimi Gray, UTCT, University of Texas
http://www.graysvertebrateanatomy.com/work/colorsofskullanatomy/
Standardized color scheme for rendering skulls.
-
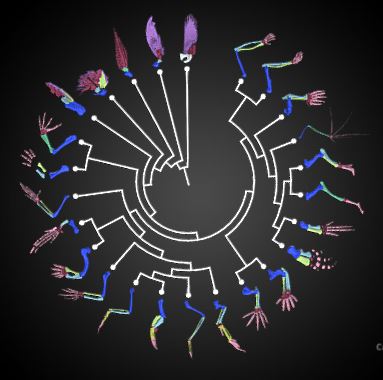
Forelimb homology 3D model collection
By Jaimi Gray, UTCT, University of Texas
http://www.graysvertebrateanatomy.com/work/forelimbhomology/
A collection of colorized skeletal forelimb models from the vertebrate tree of life.
-
University of Florida DeLeon Lab Data Post-processing Modules
By Valeria DeLeon and Rose Bryson, The University of Florida
https://www.youtube.com/@deleonlab/videos
Tutorials for analyzing and processing CT data in 3D Slicer.
-
SlicerMorph
By SlicerMorph Team, Murat Maga, Adam Summers, and Doug Boyer
https://slicermorph.github.io/
Github page for 3D Slicer plugin that streamlines data import, visualization, measurement, annotation, and geometric morphometric analysis on 3D data, including volumetric scans (CTs and MRs) and 3D surface scans.
SlicerMorph YouTube Channel: https://www.youtube.com/channel/UCy3Uz1ikRH1B7WSMfaldcjQ
SlicerMorph Tutorials: https://github.com/SlicerMorph/Tutorials
SlicerMorph Free Sample Data: https://github.com/SlicerMorph/SampleData
3D Slicer, Data Analysis, Data Postprocessing, Free Sample Data, Reconstruction, Website, YouTube Channel
-
3D Slicer Training
By 3D Slicer
https://www.slicer.org/wiki/Documentation/Nightly/Training
3D Slicer’s Wiki page of tutorials.
-
MICRO Instructions for Working with Image Stacks in FIJI (FIJI Is Just ImageJ)
By Manon Wilson, Paul Gignac, and Claire Terhune from MICRO, University of Arkansas
https://micro.uark.edu/micro-instructions-for-working-with-image-stacks-in-fiji-fiji-is-just-imagej/
Tips and tricks for manipulating CT-scanner image stacks using the free software ImageJ.
-
MICRO introduction to diceCT
By Claire Terhune and Paul Gignac at MICRO, University of Arkansas
https://micro.uark.edu/introtodicect/
Tips and tricks for diceCT staining natural history specimens, which allows for the visualization of soft-tissue structure in CT scans.
-
MICRO Specimen Packaging Recommendations for Optimal Mounting
By MICRO, University of Arkansas
Learn how to package your samples for optimal CT imaging.
-
The Virtual Paleontologist
By Anne Kort, University of Michigan
https://www.youtube.com/@VirtPaleo
Comprehensive tutorials about using, processing, and analyzing CT data primarily focused on the field of Paleontology.
3D Slicer, Blender, Data Analysis, Data Postprocessing, MeshLab, Reconstruction, Segmenting, YouTube Channel
-
Introduction to Micro-CT Scanning
By April Neander, The University of Chicago
Introductory video for the University of Chicago PaleoCT facility. Covers basic vocabulary, parts of the machine, mounting, common artefacts, and quality/speed/resolution tradeoffs.
-
Background and Theory
By April Neander, The University of Chicago
Chapter 3 of the University of Chicago PaleoCT training course. Covers basic vocabulary, parts of the machine, common artefacts, and quality/speed/resolution tradeoffs.
-
Mounting Specimens
By April Neander, The University of Chicago
Chapter 4 of the University of Chicago PaleoCT training course. Covers intro to mounting and wet specimens.
-
Pre-Scan
By April Neander, The University of Chicago
Chapter 5 of the University of Chicago PaleoCT training course. This video covers power modes, changing a dual tube system, and warmup. This video is specific to Phoenix/GE/Waygate machines.
-
Scanning with the High Power 240 kV Tube
By April Neander, The University of Chicago
Chapter 6 of the University of Chicago PaleoCT training course. Covers scanning software for Waygate machines, positioning a specimen in the scanner, how to read a histogram, scanning parameters, and detector calibration.
-
Fossils and Filters
By April Neander, The University of Chicago
Chapter 7 of the University of Chicago PaleoCT training course. Covers tips for mounting fossils, and when and how to use filters.
-
Scanning with the 180 kV nano-focus tube
By April Neander, The University of Chicago
Chapter 8 of the University of Chicago PaleoCT training course. Covers the differences between the 240 kV micro-focus and 180 kV nano-focus tubes, mounting, positioning and parameters for lower density specimens, and additional focus tools.
-
Additional Scan Tips
By April Neander, The University of Chicago
Chapter 9 of the University of Chicago PaleoCT training course. Covers mutliscan, observation ROI, and troubleshooting.
-
3D Digital Reconstruction
By April Neander, The University of Chicago
Chapter 11 of the University of Chicago PaleoCT training course. Covers reconstruction tools available on Datos, such as AGC, cropping, and other modules.
-
Data Processing Basics in VG Studio
By April Neander, The University of Chicago
Chapter 12 of the University of Chicago PaleoCT training course. Covers importing data, navigation, reorientation, cropping, and merging scans in VGStudio.
-
Basics and Physics of X-Ray Imaging & 3D Computed Tomography (Volume Graphics)
By S. Gondrom-Linke, Volume Graphics
https://www.dropbox.com/s/zlvqvtklmqdu3d3/Physics%20and%203DCT.pdf?dl=0
CT history, basics, how a CT scanning and reconstruction works with relevant mathematical explanations, and demonstration of how VGStudio Reconstruction can be used to correct artifacts.
-
X-Ray Microscopy Introduction
By Jon Giencke, Bruker
X-ray Diffraction (XRD) and X-ray Microscopy (XRM) can provide a wealth of information while being non-destructive and easily accessible. This video series includes an exciting line-up of speakers to discuss the basics of the techniques, provide some real-world examples and show the techniques in action. We hope that by watching you can broaden your knowledge on how these techniques can assist in uncovering information locked inside some of the items in your collections!
-
Micro-computed tomography for natural history specimens: a handbook of best practice protocols
Keklikoglou, Kleoniki, Sarah Faulwetter, Eva Chatzinikolaou, Patricia Wils, Jonathan Brecko, Jiří Kvaček, Brian Metscher, and Christos Arvanitidis. “Micro-computed tomography for natural history specimens: a handbook of best practice protocols.” European Journal of Taxonomy 522 (2019). https://doi.org/10.5852/ejt.2019.522
Abstract
Micro-computed tomography (micro-CT or microtomography) is a non-destructive imaging technique using X-rays which allows the digitisation of an object in three dimensions. The ability of micro-CT imaging to visualise both internal and external features of an object, without destroying the specimen, makes the technique ideal for the digitisation of valuable natural history collections. This handbook serves as a comprehensive guide to laboratory micro-CT imaging of different types of natural history specimens, including zoological, botanical, palaeontological and geological samples. The basic principles of the micro-CT technology are presented, as well as protocols, tips and tricks and use cases for each type of natural history specimen. Finally, data management protocols and a comprehensive list of institutions with micro-CT facilities, micro-CT manufacturers and relative software are included.
-
Artefacts in X-ray microtomography of materials
Davis, G. R., and J. C. Elliott. “Artefacts in X-ray microtomography of materials.” Materials science and technology 22, no. 9 (2006): 1011-1018. https://doi.org/10.1179/174328406X114117
Abstract
X-ray microtomography is becoming an increasingly popular tool in the study of microstructure and failure mechanisms in biological and engineering materials, producing three-dimensional (3D) maps of the X-ray linear attenuation coefficient. Limitations of the technique are due to, for example, limited X-ray flux, use of polychromatic radiation (in laboratory systems), finite resolution, discrete sampling and X-ray scatter. These give rise to artefacts in the reconstructed image. Knowledge of these artefacts helps to distinguish them from real features and is important for optimising experimental design so as to minimise their effect on the results. To aid identification, artefacts were simulated computationally using an analytical phantom projection generator. Streak, ring, motion and beam hardening artefacts are considered as well as the results of errors in the centre of rotation and missing information in cone beam geometry. Examples of tomographic images of real materials specimens with motion and beam hardening artefacts as well as centring errors are also shown.
-
Seattle Children’s Research Institute
By Murat Maga, Seattle Children’s Research Institute
https://faculty.washington.edu/maga/SCRI_MicroCT/
Facility Website that offers CT scanning services, hosts mouse CT Data for download, 3D Visualizations, and other useful documents.
-
Spatial Archaeometry Research Collaborations (SPARC) Teaching Resources for microCT (University of Arkansas)
By Manon Wilson, University of Arkansas
https://github.com/castuofa/sparc_microct
Educational resources including CT Data analysis and visualization focused on the field of archaeology.
-
Enhancing CT imaging: A safe protocol to stain and de-stain rare fetal museum specimens using diffusible iodine-based staining (diceCT)
Lanzetti, Agnese, and Eric G. Ekdale. “Enhancing CT imaging: A safe protocol to stain and de‐stain rare fetal museum specimens using diffusible iodine‐based staining (diceCT).” Journal of Anatomy 239, no. 1 (2021): 228-241. https://doi.org/10.1111/joa.13410
Abstract
Computed tomography (CT) scanning is being increasingly employed in the study of natural history, particularly to investigate the internal anatomy of unique specimens in museum collections. Different techniques to enhance the contrast between tissues have been developed to improve the quality of the scans while preserving the integrity of these rare specimens. Diffusible iodine-based contrast enhanced computed tomography (diceCT) was found to be particularly effective and reversible for staining tissues in formalin preserved specimens. While it can also be effectively employed to stain ethanol-preserved specimens of small size, the reversibility of this process and the applicability to large-bodied animals has never been thoroughly tested. Here, we describe a novel diceCT protocol developed to stain and de-stain ethanol-preserved prenatal specimens of baleen whales (Mysticeti, Cetacea). These large (10–90 cm in length only considering early fetal stages) specimens present unique challenges as they are rare in collections and irreplaceable, therefore it is imperative to not damage them with the staining process. Before trying this protocol on baleen whales’ specimens, we conducted a pilot study on commercially available fetal pigs using the same parameters. This allowed us to optimize the staining time to obtain the best results in CT scanning and to test first-hand the effect of de-staining on ethanol-based specimens. External coloration of the specimens is also a concern with iodine-staining, as stained specimens assume a bright red color that needs to be removed from both internal and external tissues before they can be stored. To test the reversibility of the stain in ethanol-preserved specimens with fur, we also conducted a small experiment using commercially acquired domestic mice. After these trials were successful, we applied the staining and de-staining protocol to multiple fetal specimens of mysticetes up to 90 cm in length, both ethanol- and formalin-preserved. Specimens were soaked in a solution of 1% pure iodine in 70% ethanol for 1–28 days, according to their size. After scanning, specimens are soaked in a solution of 3% sodium thiosulfate in 70% ethanol that is able to completely wash out the iodine from the tissues in a shorter time frame, between a few hours and 14 days. The same concentrations were used for formalin-preserved specimens, but DI water was used as solvent instead of ethanol. The staining technique proved particularly useful to enhance the contrast difference between cartilage, mineralized bone, teeth, and the surrounding soft tissues even when the specimens where scanned in medical-grade CT scans. The specimens did not suffer any visible damage or shrinkage due to the procedure, and in both the fetal samples and in the mice the color of the stain was completely removed by the de-staining process. We conclude therefore that this protocol can be safely applied to a variety of ethanol-preserved museum specimens to enhance the quality of the CT scanning and highlight internal morphological features without recurring to dissection or other irreversible procedures. We also provide tips to best apply this protocol, from how to mix the solutions to how to minimize the staining time.
-
X-ray computed tomography of planetary materials: A primer and review of recent studies
Hanna, Romy D., and Richard A. Ketcham. “X-ray computed tomography of planetary materials: A primer and review of recent studies.” Geochemistry 77, no. 4 (2017): 547-572. https://doi.org/10.1016/j.chemer.2017.01.006
Abstract
X-ray computed tomography (XCT) is a powerful 3D imaging technique that has been used to investigate meteorites, mission-returned samples, and other planetary materials of all scales from dust particles to large rocks. With this technique, a 3D volume representing the X-ray attenuation (which is sensitive to composition and density) of the materials within an object is produced, allowing various components and textures to be observed and quantified. As with any analytical technique, a thorough understanding of the underlying physical principles, system components, and data acquisition parameters provides a strong foundation for the optimal acquisition and interpretation of the data. Here we present a technical overview of the physics of XCT, describe the major components of a typical laboratory-based XCT instrument, and provide a guide for how to optimize data collection for planetary materials using such systems. We also discuss data processing, visualization and analysis, including a discussion of common data artifacts and how to minimize them. We review a variety of recent studies in which XCT has been used to study extraterrestrial materials and/or to address fundamental problems in planetary science. We conclude with a short discussion of anticipated future directions of XCT technology and application.
-
Experimental assessment of diffusible iodine-based contrast-enhanced computed tomography (diceCT) protocols
Costello, Lucy F., Hazel L. Richards, Alistair R. Evans, and Justin W. Adams. “Experimental assessment of diffusible iodine-based contrast-enhanced computed tomography (diceCT) protocols.” PeerJ 12 (2024): e17919. https://doi.org/10.7717/peerj.17919
Abstract
Diffusible iodine-based contrast-enhanced computed tomography (diceCT) is an increasingly used digital complement, supplement, or alternative to traditional dissection-based anatomical research. The diceCT protocol, which has evolved and expanded over the past decade, employs passive diffusion of Lugol’s iodine (KI3) to increase soft tissue radiodensity and improve structure contrast in the CT or microCT imaging of specimens. The development and application of diceCT has focused largely on specimens under 1 kg, and the varying reporting of methods on studies of both small and large specimens has initiated, but not yet established, an effective diceCT protocol for larger specimens based on monitored experiments of several fundamental variables (e.g., Lugol’s iodine concentration, duration, and impacts of Lugol’s iodine on tissues). In this study, we have experimentally assessed the efficacy of diceCT protocols for imaging whole-body specimens of the 1–4.5 kg Australian brushtail possum (Trichosurus vulpecula) using sequential CT imaging assessment across experimental conditions. We assessed the impact of varying Lugol’s iodine concentration, the presence/absence of skin, solution volume and agitation on tissue radiodensity changes through weekly CT-based monitoring of tissue radiodensities over an 8-week experimental period. We have also quantified tissue volumetric changes across our experiment to assess the impact of diceCT applications on subsequent analyses of imaging datasets. Our results indicate that substantial changes in both soft-tissue radiodensity and soft-tissue volume occur within the first 28 days of Lugol’s iodine treatment, followed by a slower rate of progressive soft-tissue radiodensity and volume changes across the experiment duration. Our results demonstrate the negligible benefit of skinning larger specimens to improve solution diffusion, and document significant soft-tissue volumetric changes with high concentration solutions (e.g., 10%) and long-duration exposure (e.g., beyond 5 weeks) that should guide individual diceCT protocol design and/or quantification and analysis for mammal specimens above 1 kg.
-
Reducing soft-tissue shrinkage artefacts caused by staining with Lugol’s solution
Dawood, Y., J. Hagoort, B. A. Siadari, J. M. Ruijter, Q. D. Gunst, N. H. J. Lobe, G. J. Strijkers, B. S. de Bakker, and M. J. B. van den Hoff. “Reducing soft-tissue shrinkage artefacts caused by staining with Lugol’s solution.” Scientific reports 11, no. 1 (2021): 19781. https://doi.org/10.1038/s41598-021-99202-2
Abstract
Diffusible iodine-based contrast-enhanced computed tomography (diceCT) is progressively used in clinical and morphological research to study developmental anatomy. Lugol’s solution (Lugol) has gained interest as an effective contrast agent; however, usage is limited due to extensive soft-tissue shrinkage. The mechanism of Lugol-induced shrinkage and how to prevent it is largely unknown, hampering applications of Lugol in clinical or forensic cases where tissue shrinkage can lead to erroneous diagnostic conclusions. Shrinkage was suggested to be due to an osmotic imbalance between tissue and solution. Pilot experiments pointed to acidification of Lugol, but the relation of acidification and tissue shrinkage was not evaluated. In this study, we analyzed the relation between tissue shrinkage, osmolarity and acidification of the solution during staining. Changes in tissue volume were measured on 2D-segmented magnetic resonance and diceCT images using AMIRA software. Partial correlation and stepwise regression analysis showed that acidification of Lugol is the main cause of tissue shrinkage. To prevent acidification, we developed a buffered Lugol’s solution (B-Lugol) and showed that stabilizing its pH almost completely prevented shrinkage without affecting staining. Changing from Lugol to B-Lugol is a major improvement for clinical and morphological research and only requires a minor adaptation of the staining protocol.
-
MicroCT for comparative morphology: simple staining methods allow high-contrast 3D imaging of diverse non-mineralized animal tissues
Metscher, Brian D. “MicroCT for comparative morphology: simple staining methods allow high-contrast 3D imaging of diverse non-mineralized animal tissues.” BMC physiology 9 (2009): 1-14. https://doi.org/10.1186/1472-6793-9-11
Abstract
Comparative, functional, and developmental studies of animal morphology require accurate visualization of three-dimensional structures, but few widely applicable methods exist for non-destructive whole-volume imaging of animal tissues. Quantitative studies in particular require accurately aligned and calibrated volume images of animal structures. X-ray microtomography (microCT) has the potential to produce quantitative 3D images of small biological samples, but its widespread use for non-mineralized tissues has been limited by the low x-ray contrast of soft tissues. Although osmium staining and a few other techniques have been used for contrast enhancement, generally useful methods for microCT imaging for comparative morphology are still lacking.
-
Systematic experiments to quantitatively assess image quality for CT scans of a Karoo tetrapod fossil
Tshibalanganda, Muofhe, Anton Du Plessis, Stephan G. Le Roux, Wendy L. Taylor, Roger MH Smith, and Claire Browning. “Systematic experiments to quantitatively assess image quality for CT scans of a Karoo tetrapod fossil.” (2019). http://wiredspace.wits.ac.za/handle/10539/27891
Abstract
Over the past decade non-destructive, three-dimensional visualization and analysis of fossils using X-ray tomography has greatly advanced palaeontological studies worldwide. Micro-computed tomography (microCT) is now accepted as best practice in palaeontological studies to augment the anatomical description of newly discovered fossils. Despite advances in laboratory microCT hardware, software and skills of users, there is a lack of clear methodologies for scanning and analysing fossils. Here we report on a systematic and detailed study of the quantitative effects of the variation of different microCT scanning parameters on the image quality of an unprepared fossilized Karoo tetrapod skull and parts of the postcrania. Results indicate that voltage variations do not increase the contrast for the bone as one would expect, and the best image quality solution is found using high frame averaging and high X-ray flux (current). Although this study was limited to one specimen, the results may find a practical use for future studies involving similar fossils.
-
Not all scans are equal: X-ray tomography image quality evaluation
Du Plessis, A., M. Tshibalanganda, and S. G. Le Roux. “Not all scans are equal: X-ray tomography image quality evaluation.” Materials Today Communications 22 (2020): 100792. https://doi.org/10.1016/j.mtcomm.2019.100792
Abstract
X-ray microtomography is widely used in materials science and engineering applications for imaging and analysis of material structure and morphology. For this purpose, and especially in the case of routine analysis tasks for industrial materials applications, confidence in obtained measurement results are crucial. Despite great progress in this field over the last 10 years, with many high-quality commercial systems now available, the lack of a simple and widely-used image quality metric that can capture all important aspects of the quality of a microCT scan, continues to hinder wider acceptance of the technology. Various errors can occur during the microCT scan process, which can potentially mask the presence of pores, or affect the volumetric measurements of interest. In this work we demonstrate a simplified image quality metric which can easily be implemented. We show how this new image quality metric is sensitive to all typical microCT scan errors and artifacts, which makes it a valuable tool for defining a required minimum image quality for an analysis. The object used is a 10 mm cube of titanium alloy (Ti6Al4V) produced by laser powder bed fusion additive manufacturing. This type of coupon sample is useful for analysis of the additive manufacturing process, but it is critical that small pores are seen with good contrast. Identical porosity analysis workflows are applied to scans with different image qualities, which demonstrates the importance of image quality for reproducible analyses of this sample type. The results have implications in defining quality values for all forms of materials analysis using the technique. This work can further lead the way to incorporating microCT into future fully automated and standardized analysis workflows for quality control, when image quality meets a specified minimum criterion.
-
Acquisition, optimization and interpretation of X-ray computed tomographic imagery: applications to the geosciences
Ketcham, Richard A., and William D. Carlson. “Acquisition, optimization and interpretation of X-ray computed tomographic imagery: applications to the geosciences.” Computers & Geosciences 27, no. 4 (2001): 381-400. https://doi.org/10.1016/S0098-3004(00)00116-3
Abstract
High-resolution X-ray computed tomography (CT) is a novel technology ideally suited to a wide range of geological investigations. It is a quick and nondestructive method to produce images that correspond closely to serial sections through an object. Sequential contiguous images are compiled to create three-dimensional representations that can be manipulated digitally to perform efficiently a large array of measurement and visualization tasks. Optimal data acquisition and interpretation require proper selection of scanning configuration, use of suitable X-ray sources and detectors, careful calibration, and attention to origins and modes of artifact suppression. Visualization of CT data typically profits from the ability to view arbitrarily oriented sections through the three-dimensional volume represented by the data, and from the capability to extract features of interest selectively and display perspective views of them using methods of isocontouring or volume rendering. Geological applications include interior examination of one-of-a-kind fossils or meteorites; textural analysis of igneous and metamorphic rocks; geometric description and quantification of porosity and permeability in rocks and soils; and any other application demanding three-dimensional data that formerly required physical serial sectioning.